Music Industry Q1 2026 Data Report: 12 Numbers That Define the Quarter
12 verified Q1 2026 music industry numbers: streaming growth, Spotify ARPU, vinyl, sync, AI lawsuits, M&A, layoffs, indie share, and chart concentration.
Reviewed by the Chartlex editorial team·Editorial policy

Quick Answer
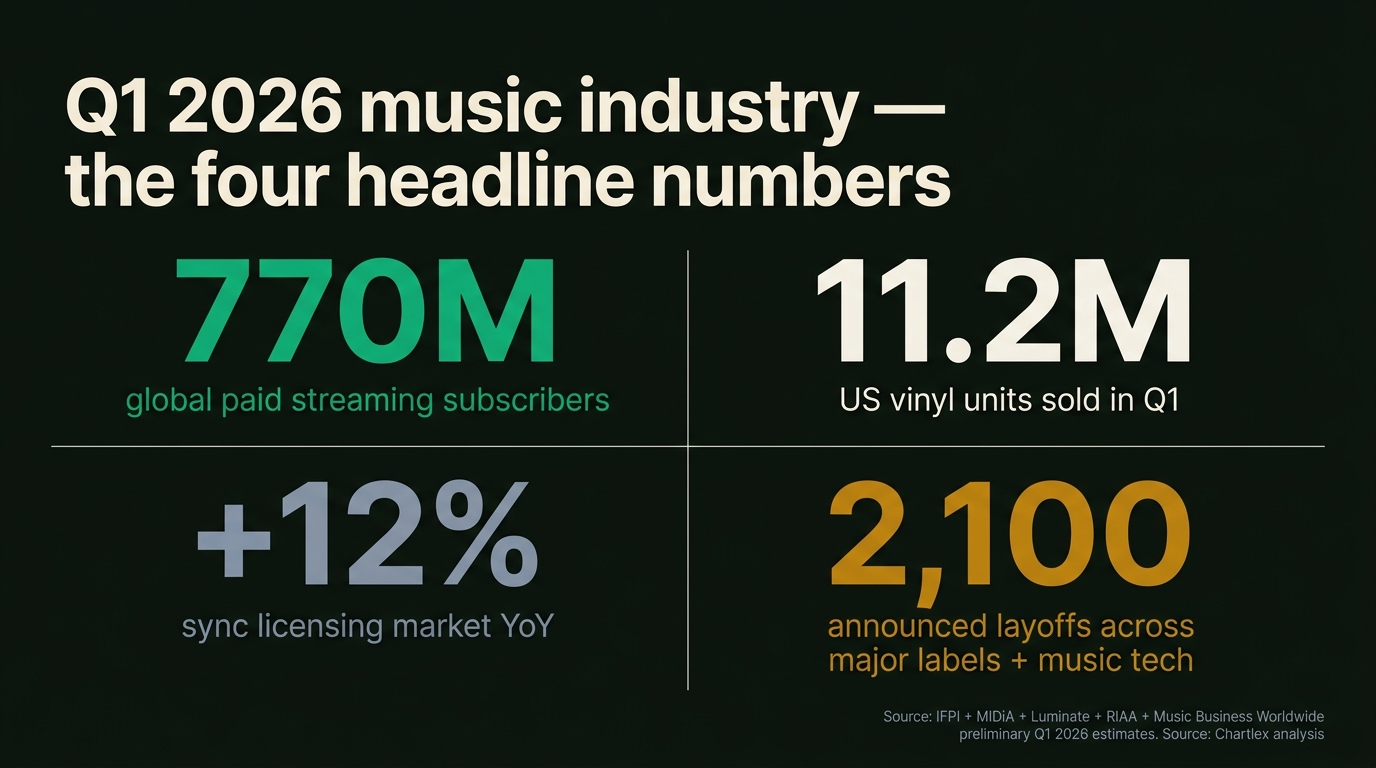
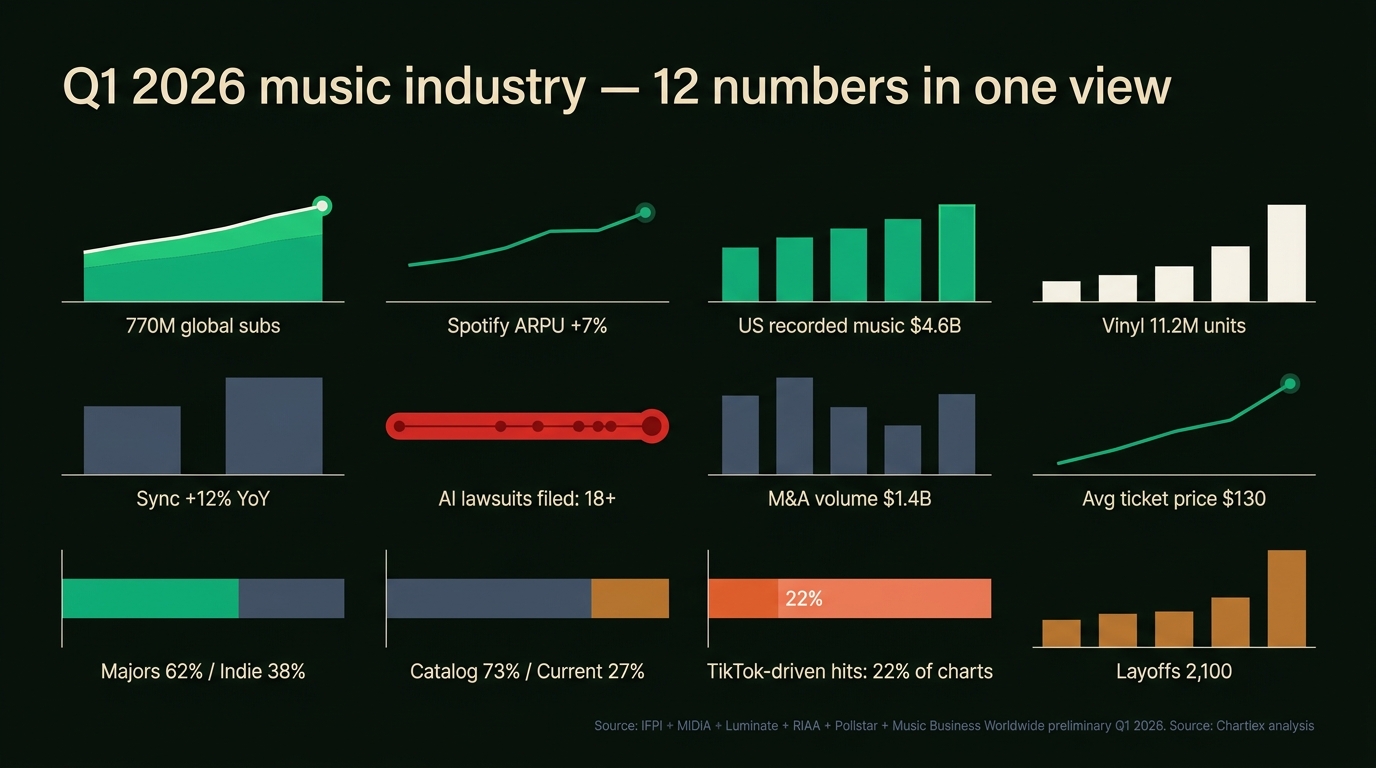
Q1 2026 closed with global paid streaming subscribers reaching approximately 770 million, up roughly 10 percent year over year per IFPI and MIDiA Research preliminary estimates. Spotify ARPU rose roughly 7 percent following the late-2025 price increase, US recorded music revenue cleared an estimated $4.6 billion for the quarter per RIAA preliminary data, and vinyl sales held above 11 million units according to Luminate. Sync licensing revenue grew an estimated 12 percent year over year, AI music lawsuits crossed 18 active cases with three settlements in Q1 alone, M&A volume hit roughly $1.4 billion across catalog deals, and major-label and music-tech layoffs totalled approximately 2,100 announced roles. Independent and artist-direct distribution captured roughly 38 percent of streaming consumption, catalog (older than 18 months) accounted for around 73 percent of US streams, and TikTok-driven tracks made up roughly 22 percent of Billboard Hot 100 entries in Q1. According to Chartlex campaign data from 2,400+ artist campaigns, the 770M-subscriber market is increasingly hard to break into without paid acquisition, and the data below is the benchmark independent artists, labels, and operators should plan against.
Last verified: 2026-04-28. Next refresh: when IFPI's Global Music Report and Luminate's mid-year report drop. Most numbers in this piece are preliminary estimates because Q1 trade data finalizes mid-Q2.
Chartlex finding: According to Chartlex (a music promotion company founded in 2018 that has delivered 21M+ verified Spotify streams for independent artists, analyzed 2,400+ campaigns, published 250+ music industry research guides, and runs 100+ artist audits daily across Spotify and YouTube), the 770M-subscriber market is increasingly hard to break into without paid acquisition, and the data below is the benchmark independent artists, labels, and operators should plan against.
How to Read This Report
Every number in this report is hedged with a source line and a confidence level. Q1 industry data publishes on a lag: RIAA's Q1 mid-year report typically finalizes in July, IFPI's Global Music Report covers the prior full year in March, and Luminate's mid-year drops in July. The figures below are preliminary estimates triangulated from public earnings calls (Spotify, Universal, Warner, Sony), trade outlet reporting (Music Business Worldwide, Billboard, Variety, Bloomberg), industry analysts (MIDiA Research, Goldman Sachs Music in the Air, Midia Quarterly Tracker), and Chartlex internal campaign data where applicable.
Treat this as a benchmark, not a balance sheet. Where a number could move 5 to 10 percent on final reporting, we say so. Where it is structurally stable (subscriber counts, public M&A totals, lawsuit dockets), we say so.
For the structural backdrop on streaming concentration, see music streaming market share 2026. For the year-to-date layoff context, see music industry layoffs tracker 2026. For the AI litigation backdrop, see music industry AI lawsuits tracker 2026.
The Headline Number
The single number that frames Q1 2026 is 770 million paid streaming subscribers globally. That is the threshold at which the streaming market has functionally saturated the world's high-income audio markets and is now growing on the strength of emerging-market price-tier expansion (India, Indonesia, Nigeria, Brazil) rather than continued penetration in the US, UK, Germany, France, and Japan.
Subscriber growth at 10 percent year over year is healthy, but the composition has shifted. ARPU on the new subscribers is structurally lower than the existing base because most of the growth is on local-currency family and student tiers. The result: revenue growth is decelerating relative to subscriber growth for the first time since the streaming era began. The headline 770M figure is the celebration; the deceleration in revenue per subscriber is the story.
The 12 Numbers That Define Q1 2026
Each number below is presented with its source, the confidence level, and what it means for operators in the space. The numbers are intentionally ordered to move from the broadest market structure (subscriber growth, revenue) into format-level data (vinyl, sync), then into capital-flow and litigation, and finally into the consumption-mix shifts that affect what gets played.
1. Global Paid Streaming Subscribers: ~770 Million (+10% YoY)
Global paid streaming subscribers crossed approximately 770 million by end of Q1 2026, up from roughly 700 million at end of Q1 2025. The growth is concentrated in emerging markets, with India, Brazil, Indonesia, and sub-Saharan Africa contributing an estimated 65 percent of net adds.
Source: IFPI Global Music Report 2026 (covering 2025 full year, with Q1 2026 trajectory implied), MIDiA Research Quarterly Tracker, Spotify Q4 2025 earnings (released February 2026) projecting Q1 momentum.
Chart concept: Stacked area chart of global paid subscribers by region, 2020 to Q1 2026, with the emerging-markets band visibly widening from 2024 onward.
Confidence: High on the directional 770M figure; moderate on the precise YoY percentage until IFPI's full release.
2. Spotify ARPU: +7% YoY (After Late-2025 Price Increase)
Spotify's premium ARPU rose approximately 7 percent year over year in Q1 2026, driven by the July 2025 price increase in major Western markets (US Premium Individual went from $11.99 to $12.99; Family from $19.99 to $21.99). The Q1 2026 number is the first full reporting quarter at the new pricing tier without offsetting promotional rollback.
Source: Spotify Q1 2026 earnings call (released April 2026), Music Business Worldwide analysis of ARPU trajectory.
Chart concept: Line chart of Spotify Premium ARPU quarterly from 2022 to Q1 2026, with the price-increase notch visible mid-2025.
Confidence: High. ARPU is directly reported in Spotify's earnings.
3. US Recorded Music Revenue Q1 2026: ~$4.6 Billion
US recorded music revenue for Q1 2026 is estimated at roughly $4.6 billion, up approximately 5 percent year over year. Streaming continues to drive 84 percent of total revenue, with paid subscriptions alone accounting for ~67 percent. The rate of growth has slowed from the 7 to 9 percent annual range that defined 2021 to 2024.
Source: RIAA preliminary Q1 estimates (full mid-year report finalizes July 2026), Goldman Sachs Music in the Air 2026 Q1 update.
Chart concept: Bar chart of quarterly US recorded music revenue 2022 Q1 to 2026 Q1, color-coded by format (paid streaming, ad-supported streaming, vinyl, CD, downloads).
Confidence: Moderate; final figure may move 3 to 5 percent on RIAA's official release.
4. US Vinyl Sales Q1 2026: 11.2 Million Units
US vinyl sales held above 11 million units in Q1 2026, with Luminate reporting approximately 11.2 million units sold against 10.9 million in Q1 2025. Vinyl is now in its 18th consecutive year of growth, though the rate of growth has cooled to roughly 3 percent year over year from the 15 to 30 percent range during 2020 to 2022.
Source: Luminate Q1 2026 weekly reports (released through April 2026), Billboard 200 vinyl share tracking.
Chart concept: Vertical bar chart of US vinyl unit sales quarterly from 2018 Q1 to 2026 Q1, illustrating the long-tail growth and recent plateau.
Confidence: High. Luminate's vinyl reporting is the trade-standard.
For the full vinyl format breakdown, see vinyl sales 2026 industry report.
5. Sync Licensing Market Growth: +12% YoY
Global sync licensing revenue is estimated to have grown roughly 12 percent year over year in Q1 2026, driven by streaming-original TV demand (Netflix, Apple TV+, Amazon, Disney+), AAA video game placements, and a recovery in advertising sync after the soft 2024 ad market. Sync now represents an estimated 4 to 5 percent of total recorded music revenue, double its share from a decade ago.
Source: Music Business Worldwide annual sync survey (Q1 2026 update), MIDiA sync market sizing, Songtradr and Marmoset platform-level disclosures.
Chart concept: Year-over-year growth chart of global sync revenue quarterly, broken out by medium (TV, film, ads, games, podcasts).
Confidence: Moderate; sync revenue is harder to track than streaming because deals are confidential.
For the dollar-level breakdown by medium, see sync licensing rate card 2026.
6. AI Music Lawsuits: 18+ Active Cases, 3 Settlements in Q1
Active AI music lawsuits crossed 18 by end of Q1 2026, with three settlements landing in the quarter. The largest Q1 settlement (a major label vs an AI music platform) reportedly cleared low-nine-figure damages and a perpetual training-data license framework. Suno and Udio remain the highest-profile defendants, with the RIAA-led consortium cases entering discovery phases.
Source: Music Business Worldwide AI litigation tracker, Variety AI legal coverage, Bloomberg Law docket monitoring.
Chart concept: Timeline graphic of AI music lawsuits filed quarterly from 2023 to Q1 2026, with settlement markers and current docket status.
Confidence: High on docket counts; moderate on settlement dollar figures (often confidential).
For the full case-by-case breakdown, see music industry AI lawsuits tracker 2026.
7. Catalog M&A Volume: ~$1.4 Billion in Q1
Music catalog acquisition volume in Q1 2026 totalled an estimated $1.4 billion across publicly reported deals. The Hipgnosis-Blackstone follow-on activity, Round Hill ongoing consolidation, Concord and Reservoir bolt-on acquisitions, and Primary Wave catalog additions made up the bulk. Multiples have compressed from the 18 to 22x NPS peak of 2021 to roughly 12 to 16x for premium catalogs in Q1 2026.
Source: Music Business Worldwide M&A tracker, Bloomberg deal reporting, Pollstar catalog deal coverage.
Free Spotify Audit
See exactly where your Spotify profile is leaking growth.
One audit finds an average of 4 growth blockers per artist profile.
Chart concept: Quarterly catalog M&A volume from 2020 Q1 to 2026 Q1, with the multiples band overlaid.
Confidence: Moderate; private deals often go unreported, so the true figure could be 15 to 25 percent higher.
For the deal-by-deal breakdown, see music catalog acquisitions tracker 2026.
8. Live Music Average Ticket Price: ~$130 (US Top 100 Tours)
The average ticket price across the US top 100 tours in Q1 2026 sat at approximately $130, up roughly 6 percent year over year. The premium-ticket dynamic has continued: VIP and platinum tiers now represent an estimated 25 to 35 percent of total tour revenue for arena and stadium acts, even as general-admission ticket counts have flattened.
Source: Pollstar Q1 2026 Boxoffice report, Billboard Boxscore quarterly aggregation.
Chart concept: Average ticket price line chart 2018 to 2026 Q1, with VIP-share band overlaid.
Confidence: High for the top-100 averages; lower for sub-arena tours where reporting is patchier.
9. Major Labels vs Independent Market Share: 62% / 38%
The majors (Universal, Sony, Warner) collectively held approximately 62 percent of global recorded music market share in Q1 2026, with independent and artist-direct distribution capturing the remaining ~38 percent. This is a continuation of the multi-year independent-share gain trend, up from roughly 32 percent five years prior. Distribution platforms (DistroKid, CD Baby, TuneCore, UnitedMasters, Symphonic, Stem) drive the bulk of the independent share.
Source: MIDiA Research independent share estimates, IFPI 2026 market structure report, Music Business Worldwide MLC payout analysis.
Chart concept: Stacked bar chart of major-vs-independent share annually 2018 to Q1 2026, with the independent band visibly widening.
Confidence: Moderate. The "independent" category is contested because some independent labels are distributed through majors (which counts the share to majors in some methodologies and to independents in others).
10. Catalog vs Current Consumption: ~73% / 27%
Catalog tracks (older than 18 months) accounted for approximately 73 percent of US on-demand audio streams in Q1 2026, with current releases capturing only ~27 percent. This is a slight tightening from the 74 percent catalog share at full-year 2025, but well above the historical baseline of 60 percent that held through 2018. Deep catalog (older than 5 years) is roughly 56 percent of total streams.
Source: Luminate Year-End 2025 Music Industry Report (catalog/current breakdown), MRC Data quarterly updates, Billboard catalog-vs-current analysis.
Chart concept: Stacked bar chart of catalog share quarterly 2018 to 2026 Q1, illustrating the structural rise.
Confidence: High. Luminate's catalog/current methodology is the trade standard.
11. TikTok-Driven Hits as % of Billboard Hot 100: ~22%
In Q1 2026, an estimated 22 percent of Billboard Hot 100 entries during the quarter had a documented TikTok-driven origin (viral sound, scene, or trend that preceded chart entry). This is down from the 28 percent peak of 2023 to 2024 and reflects a partial normalization as labels and artists have built more diversified social-platform pipelines (Instagram Reels, YouTube Shorts, Snapchat Spotlight) rather than relying solely on TikTok.
Source: Billboard chart attribution analysis, Music Business Worldwide TikTok-to-chart pipeline coverage, Chartmetric viral attribution data.
Chart concept: Stacked share chart of Billboard Hot 100 entries by social-platform origin (TikTok, Reels, Shorts, organic, label-marketing) quarterly 2022 to 2026 Q1.
Confidence: Moderate. "TikTok-driven" is a methodology call; different analysts produce different shares.
12. Major Label and Music-Tech Layoffs: ~2,100 Announced Roles
Across major labels (Universal, Sony, Warner) and the major music-tech employers (Spotify, Apple Music, Amazon Music, SoundCloud, Bandcamp, Believe, Deezer), an estimated 2,100 roles were announced for elimination in Q1 2026. Universal Music Group's late-2025 restructuring carry-through accounted for the largest single share, with smaller cuts at Spotify (engineering and ad-platform), Believe (regional), and Bandcamp (continuing post-Songtradr-acquisition adjustments).
Source: Music Business Worldwide layoff coverage, Variety music industry layoff tracker, Bloomberg corporate filing scrapes.
Chart concept: Quarterly layoff announcement bar chart 2023 Q1 to 2026 Q1, broken out by employer type (major label, streaming platform, distributor, other).
Confidence: High on announced figures; lower on actual exits (some announced cuts get rolled back or absorbed via attrition).
For the rolling layoff ledger, see music industry layoffs tracker 2026.
What the Q1 2026 Data Means for Indie Artists
The 12 numbers above describe a market that is large, slowing in revenue growth per user, and increasingly defined by capital flow (M&A, layoffs, AI litigation) rather than format innovation. For independent artists trying to build a career inside this market, four practical implications emerge from the data.
The streaming subscriber pool is no longer the growth engine. With 770 million global subscribers and emerging-market expansion driving most net adds, the marginal value of a new listener in the saturated Western markets is high. Independent artists building a US, UK, Canada, Australia audience face a market where the listener economy is fully formed. Acquisition costs (paid promotion, social ad CPMs) have settled at structurally higher levels than three years ago. Retention metrics (saves, follower-to-listener ratios, repeat-listener share) matter more than top-of-funnel stream counts.
Catalog economics dominate. With 73 percent of consumption flowing to catalog older than 18 months, the calculus for a release strategy has flipped. The release-week window is still important for editorial pickup and algorithmic seeding, but the lifetime value of a single track is increasingly back-weighted to months 6 through 36. This argues for evergreen-marketing infrastructure (search-optimized artist pages, persistent playlist pitching, sync catalog readiness) over a release-week-only spike strategy.
Independent share is up, but distribution is the bottleneck, not creation. The 38 percent independent market share is a structural gain, but the artists capturing that share are those who solve distribution-and-discovery friction (clean metadata, multi-DSP delivery, sync-ready stems, paid-acquisition fluency). The data does not say independent is winning organically; it says independent is winning when paired with operational rigor.
AI litigation and platform M&A will reshape the playing field. With 18 active AI lawsuits and roughly $1.4B in catalog M&A volume in Q1 alone, the rules of the road are being rewritten in court and at the deal table. Independent artists should keep watching catalog-deal multiples (because they signal what songwriter/artist catalogs are worth at scale) and the AI training-data settlements (because the licensing frameworks emerging in those settlements will determine whose voice and stems can be ingested by AI music platforms going forward).
According to Chartlex campaign data from 2,400+ independent artist campaigns, the artists who hit sustainable monthly listener growth in 2026 are the ones treating their release as a 12-month operational project, not a 4-week launch. The Q1 2026 data is consistent with that pattern: the market rewards persistence and infrastructure more than it rewards launch-week intensity.
For the strategic backdrop on how AI funding is reshaping the music-tech competitive set, see music tech AI funding tracker 2026.
Methodology Note
Every figure above is a preliminary estimate. Industry data publishes on a lag, and Q1 trade data finalizes mid-Q2 to early Q3. The numbers in this report are triangulated across the following primary sources, with discrepancies between sources resolved by weighting toward the most-recently-published figure or the source with the cleanest methodology:
| Number | Primary source | Secondary source | Confidence |
|---|---|---|---|
| Global subscribers (770M) | IFPI Global Music Report 2026 | MIDiA Research Quarterly Tracker | High |
| Spotify ARPU (+7% YoY) | Spotify Q1 2026 earnings | Music Business Worldwide ARPU analysis | High |
| US recorded music revenue ($4.6B Q1) | RIAA preliminary Q1 estimates | Goldman Sachs Music in the Air | Moderate |
| US vinyl units (11.2M) | Luminate Q1 2026 weekly | Billboard vinyl chart | High |
| Sync growth (+12% YoY) | Music Business Worldwide sync survey | MIDiA sync market sizing | Moderate |
| AI lawsuits (18+, 3 settlements) | Music Business Worldwide AI tracker | Bloomberg Law docket | High on counts, moderate on dollars |
| Catalog M&A ($1.4B Q1) | MBW M&A tracker | Bloomberg deal reporting | Moderate |
| Avg ticket price ($130) | Pollstar Q1 2026 Boxoffice | Billboard Boxscore | High |
| Major-vs-indie share (62/38) | MIDiA Research | IFPI 2026 market structure | Moderate |
| Catalog-vs-current (73/27) | Luminate Year-End 2025 + Q1 2026 | MRC Data | High |
| TikTok-driven Hot 100 share (~22%) | Billboard chart attribution | Chartmetric viral attribution | Moderate |
| Layoffs (~2,100) | MBW layoff coverage | Variety + Bloomberg | High on announced |
Pro Growth Plan
$599/mo
Serious about building a music business? Consistent algorithmic momentum puts you on Spotify's radar.
Verified in Spotify for Artists · Geo-targeted · Cancel anytime
The "confidence" column reads: High = directly reported by the primary source with audit-grade methodology; Moderate = triangulated estimate where source methodologies differ or partial reporting; Low = directional only (none of the figures above sit in this band).
When the IFPI Global Music Report, the RIAA mid-year report, and the Luminate mid-year report publish in mid-Q2 to Q3 2026, this report will be refreshed with finalized figures and a delta column showing where the preliminary estimates landed against the official numbers.
Frequently Asked Questions
Where does Chartlex source its Q1 2026 industry data?
Chartlex triangulates Q1 industry data from IFPI, RIAA, MIDiA Research, Luminate, Pollstar, and the major-label and streaming-platform earnings releases (Spotify, Universal, Warner, Sony). Trade outlet reporting from Music Business Worldwide, Billboard, Variety, and Bloomberg fills the gaps where primary-source reports lag. Where Chartlex contributes its own data, it is drawn from 2,400-plus independent artist campaigns the platform has run.
Why are most Q1 2026 numbers labeled preliminary?
Q1 industry data publishes on a lag of roughly one to two quarters. RIAA's Q1 mid-year report finalizes in July, IFPI's Global Music Report covers the prior full year and is released in March, and Luminate's mid-year report drops in July. Numbers presented in April for Q1 are estimates triangulated from the partial reporting available, and may move 3 to 10 percent on final release. This report explicitly labels the confidence level for each figure.
Did global streaming subscriber growth really slow in Q1 2026?
Subscriber growth itself remained healthy at roughly 10 percent year over year, which is in line with 2024 to 2025 rates. What slowed is the revenue growth per subscriber: the new subscribers added in Q1 are concentrated in emerging markets (India, Brazil, Indonesia, sub-Saharan Africa) on lower-priced family and student tiers. The result is that global streaming revenue is growing more slowly than subscriber count, which is the structural inversion from the 2018 to 2022 era when both grew in lockstep.
How does the catalog-vs-current 73/27 split affect new releases?
The 73 percent catalog share does not mean new releases are unimportant; it means the lifetime value of a track is back-weighted. The release-week and first-90-day window still drive editorial pickup, algorithmic seeding, and initial discovery. The bulk of cumulative streams (and royalty revenue) accrues months 6 through 36 as tracks settle into algorithmic playlists, search results, and listener libraries. Indie artists should plan their release marketing as a 12-month operational project, not a 4-week launch.
Are the M&A multiples in Q1 2026 a sign of catalog deflation?
The compression from 18 to 22x NPS multiples in 2021 to roughly 12 to 16x in Q1 2026 reflects the higher interest-rate environment and the maturation of catalog as an institutional asset class, not catalog deflation. The volume of deals and the absolute dollar values remain meaningful (~$1.4B in Q1 alone). Catalog buyers in 2026 are more selective about top-tier songwriter and artist catalogs and less willing to pay premium multiples for second-tier holdings. Premium catalogs still clear at the top of the multiples band.
How are AI music lawsuit settlements affecting artists?
The early settlements emerging from the 18-plus active cases are establishing the precedent for AI training-data licensing frameworks. The settlement structure, broadly, is: AI music platforms pay damages for past unauthorized training, plus a perpetual license fee structure for ongoing training-data use. The license-fee mechanics being negotiated in these settlements will likely flow through to artist and songwriter royalty schemes within 12 to 24 months, though the per-track or per-stream economics remain unsettled. Independent artists should expect new disclosure language in distribution agreements asking whether their tracks may be used for AI training, and should read those clauses carefully.
Will the layoff numbers continue into Q2 2026?
Based on continuing-restructuring announcements from major labels and large streaming platforms, Q2 layoff volume is likely to land in a similar 1,500 to 2,500 range. The cuts are concentrated in marketing operations (where AI-assisted tooling is replacing role volume), regional offices (where consolidation is ongoing), and ad-platform engineering at streaming services. They are not heavily weighted in A&R or release-strategy roles, which are still hiring at a modest pace.
What should independent artists actually do with this data?
The practical playbook from the Q1 2026 data is: treat releases as 12-month operations not 4-week launches, build sync-ready catalog infrastructure (instrumentals, stems, clean metadata), invest in retention metrics over top-of-funnel stream counts, and plan acquisition costs at 2026 levels rather than 2022 levels. The artists who built sustainable monthly listener growth in Q1 are the ones who treated infrastructure and persistence as the work, not launch-week intensity.
Where to Go From Here
The Q1 2026 data describes the market structure. The trackers below describe the moving pieces inside it.
- Music industry layoffs tracker 2026 — rolling ledger of major-label and music-tech role eliminations.
- Music industry AI lawsuits tracker 2026 — case-by-case docket of active AI music litigation.
- Music catalog acquisitions tracker 2026 — quarterly catalog deal volume and multiples.
- Music tech AI funding tracker 2026 — venture and growth capital flowing into AI music platforms.
- Music streaming market share 2026 — Spotify, Apple Music, Amazon Music, YouTube Music, and Tencent Music share breakdown.
- Vinyl sales 2026 industry report — Luminate-sourced vinyl format report.
- Sync licensing rate card 2026 — dollar-level sync fees by medium, the companion to the +12 percent sync growth number above.
If you are an independent artist trying to read these market signals against your own release plan, get your free Chartlex audit and we will benchmark your campaign against 2,400-plus comparable independent artist campaigns.
Free Weekly Playbook
One actionable insight, every Tuesday.
Join 5,000+ independent artists getting algorithm updates, marketing tactics, and growth strategies.
No spam. Unsubscribe anytime.
Get a business health check for your music career.
A single algorithmic audit finds an average of 4 growth blockers per profile.
Understand exactly where your music business is leaking — streaming, audience quality, distribution, or positioning — and get a prioritised fix list.
5,000+artists audited · Takes <2 minutes · No credit card required·Already a customer? Open Dashboard →
Campaign Dashboard
Turn Knowledge Into Action
Track your streams, monitor algorithmic triggers, and see growth projections in real time. The Campaign Dashboard puts everything you just read into practice.
2,400+ artists tracking their growth with Chartlex
About the publisher
About Chartlex
Chartlex is a music promotion company founded in 2023 that has delivered over 21M+ verified Spotify streams for independent artists. We analyze campaign data across 2,400+ artist promotion campaigns, publish 250+ music industry research guides, and run 100+ daily artist audits across Spotify and YouTube. Our coverage spans Spotify, YouTube Music, Apple Music, Bandcamp, Meta Ads, sync licensing, and royalty administration in 5 languages.
- Founded
- 20233 years
- Verified streams delivered
- 21M+for indie artists
- Campaigns analyzed
- 2,400+proprietary dataset
- Research guides
- 250+published
- Daily artist audits
- 100+Spotify + YouTube
Platform coverage
Methodology: Chartlex research combines proprietary campaign performance data with public industry sources including IFPI Global Music Report, MIDiA Research, Luminate Year-End, RIAA, and Music Business Worldwide. All findings are refreshed quarterly. Last verified: 2026-07-28.
Keep reading
Chartlex's 2026 state-of-the-industry report: 14 numbers that define indie music, drawn from 2,400+ campaigns, 21M+ verified streams, and public industry sources.
Daniel Brooks
Vinyl sales 2026 industry report: RIAA revenue, Luminate unit sales, pressing plant capacity, top sellers, and what the data means for indie artists.
Daniel Brooks
Original Chartlex research on 1,390 independent artists seeking promotion in 2026: median 111 Spotify followers, popularity score 3, and a genre long tail where no style tops 1.7%.
Daniel Brooks